This release focuses on financial clarity, self-serve support, and operational awareness. The NOI Trend chart replaces the older split-view income and expense charts with a unified, comparison-ready surface; a new help layer brings contextual video guidance directly into the modules where users need it most; a Recent Activity feed keeps teams informed of changes across the app in real time; and budget columns in the T-X Financial Summary make variance analysis faster without leaving the report.
New Additions
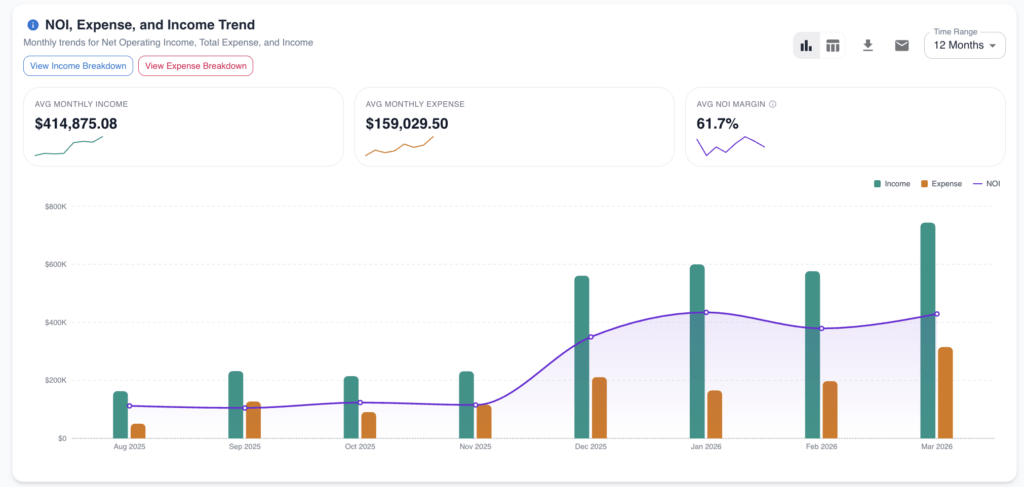
NOI Trend Chart
The financial dashboard now features a unified NOI Trend chart — located in the main financial dashboard view — that replaces the previous split Expense and Income Trend charts. From this single surface, users can toggle between time windows and read any data point three ways at once using an inline YoY / MoM tooltip. This eliminates the need to flip between multiple charts to contextualize performance, and a post-date aggregation fix ensures monthly totals are now correctly calculated.
Help Videos & Help Icons
A self-serve help layer has been wired into the global Help section and embedded directly into key modules throughout the app. Users will now see contextual help icons within the pages they’re working on; clicking one launches a Loom walkthrough video specific to that feature or workflow — including dedicated videos covering the Comps tree and upload flow. This reduces reliance on external support for onboarding and process questions.
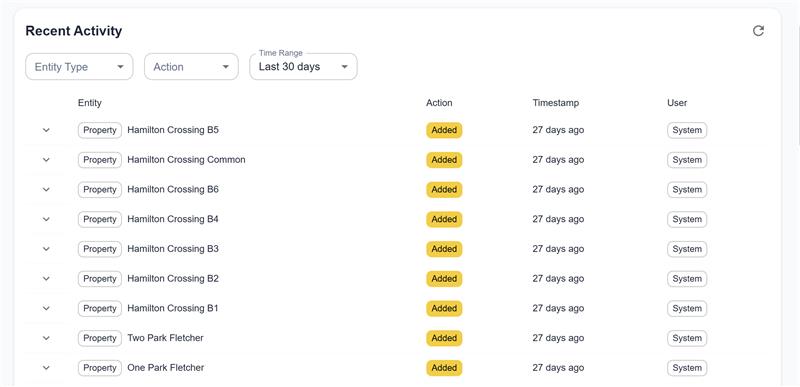
Recent Activity — Notification Surface
A new Recent Activity dropdown has been added to the app shell, giving users a persistent view of actions taken across the platform. The feed supports filtering by activity type and pulls from an expanded set of entity types and actions — meaning more parts of the app now generate visible activity events. A notification template has also been established to support additional activity-style alerts in future releases. Teams working across multiple records or portfolios gain real-time awareness without relying on direct communication.
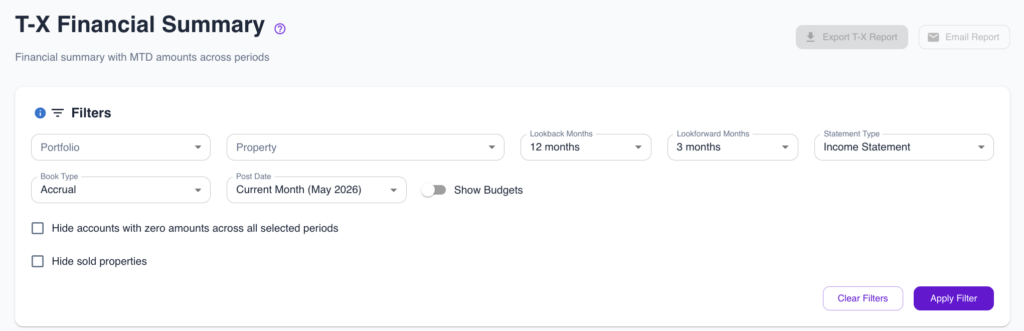
T-X Financial Summary — Show Budgets Toggle
The T-X Financial Summary report now includes a Show Budgets toggle that adds per-period budget columns alongside actuals, enabling direct variance comparisons within a single report view. In the same update, the five financial reports have been reordered so the most frequently used reports appear first. This reduces the steps required to move from raw data to actionable budget comparisons.
If you have feedback or feature requests, we’d love to hear from you.