This release introduces deeper unit-level insights, expanded financial breakdown capabilities, and new governance tools to help teams manage property and unit data more effectively. These enhancements are designed to improve transparency, strengthen reporting accuracy, and give users more detailed visibility into leasing, occupancy, and financial performance across their portfolios.
Released Features
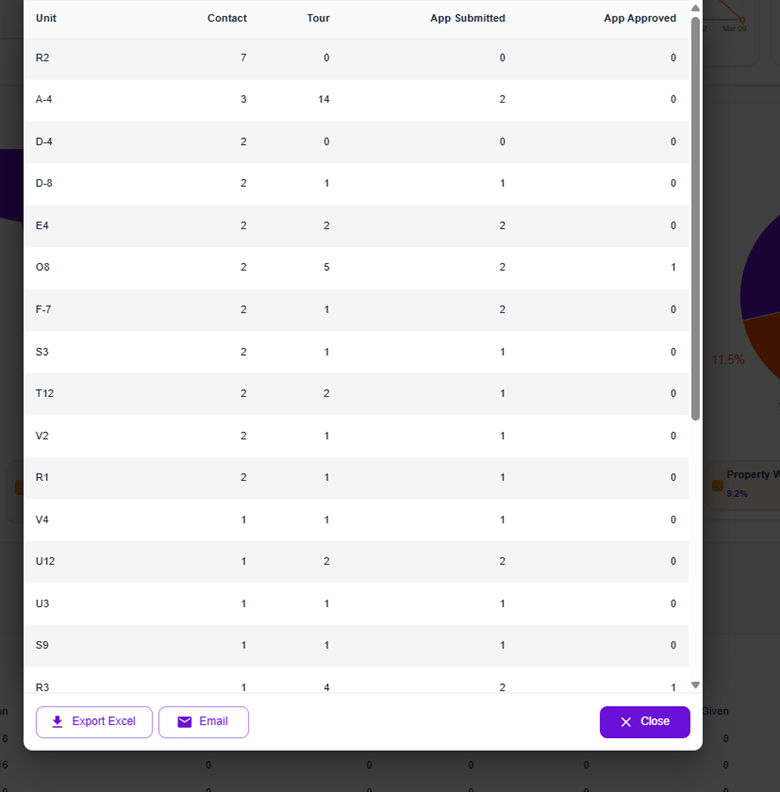
Unit-Level Drill-Down in Leasing & Occupancy
Users can now drill down to individual unit details directly from the Multifamily Leasing Analytics and Multifamily Occupancy reports. This new capability allows teams to explore unit-specific leasing data and occupancy metrics from the dashboard, providing deeper operational visibility into property performance.
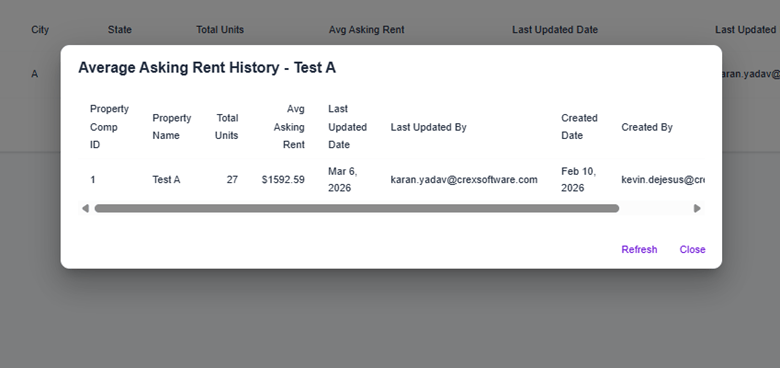
Leasing Comp History
A new Leasing Comp History feature has been introduced that tracks and records changes to leasing comps over time. A dedicated comp history table now saves historical snapshots whenever comp data is modified, giving users full audit trail visibility within the comps section.
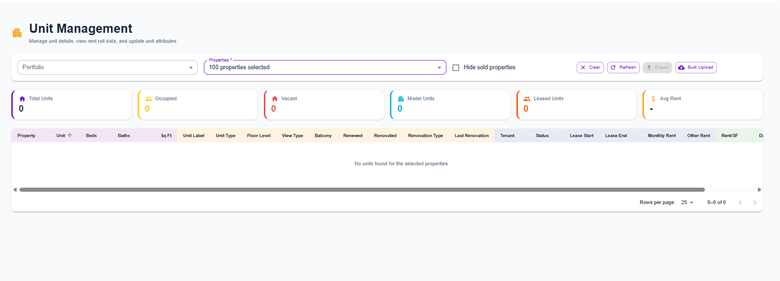
Unit Management Page
A new Unit Data Governance page has been launched for managing unit-level data. This includes a dedicated unit management interface along with an updated Excel template for bulk unit data uploads, giving teams better control over unit data quality and standardization.
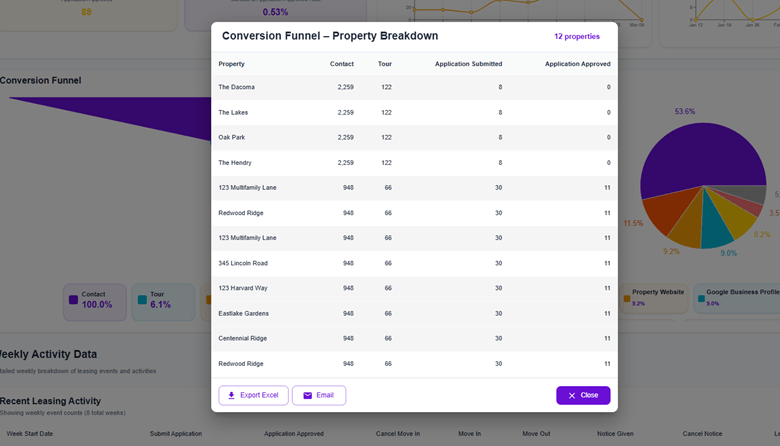
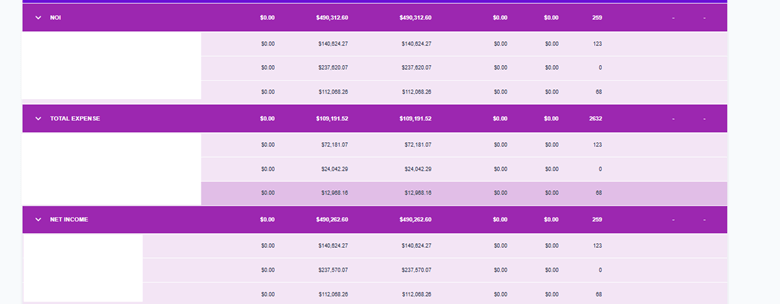
Property-Level Breakdown with Waterfall Charts
Inline property-level breakdowns have been added for NOI, Total Expense, and Net Income across the Financial Dashboard, Financial Summary, and T-12 reports. A new calculated property breakdown API endpoint powers this feature, and the waterfall chart design has been updated to provide a clearer visual representation of how individual properties contribute to portfolio-level financials.
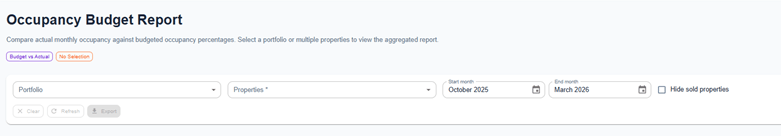
Occupancy Budget Date Range Filter
The Occupancy Budget report now supports a date range filter. Users can select custom date ranges to narrow down occupancy budget data, making it easier to analyze specific time periods rather than viewing the entire dataset at once.
Other Rent Integration
A new Other Rent data category has been integrated into the platform, expanding the scope of rent-related data tracked and reported across the system.
Upcoming releases
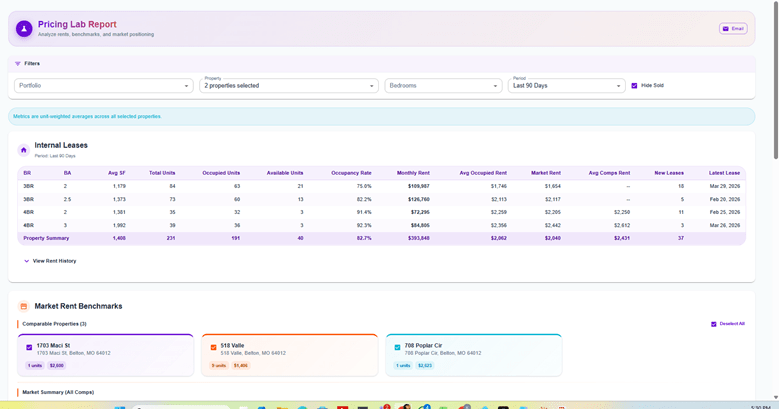
Pricing Lab Reports
A brand-new Pricing Lab page is being built with line graph visualizations and internal lease analytics. This tool will help teams analyze pricing trends and make data-driven rent pricing decisions based on historical and comparable lease data.
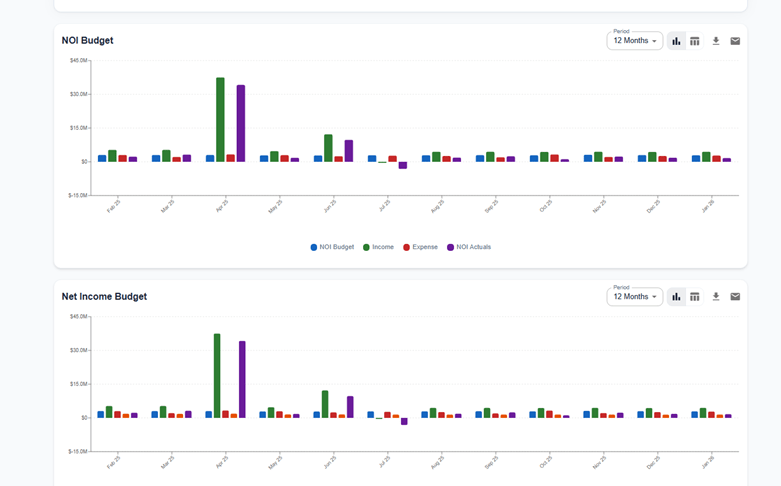
Budget Waterfall Charts
New NOI Budget and Net Income Budget waterfall charts are currently in development. These charts will provide a visual breakdown of budget components, making it easier to understand how individual line items contribute to overall NOI and Net Income budget figures.
If you have feedback or feature requests, we’d love to hear from you.