This week’s updates introduce new trend charts, enhanced filtering controls, and improved financial variance accuracy. These enhancements are designed to provide clearer visibility into performance metrics while strengthening reporting precision across financial and multifamily modules.
New Additions
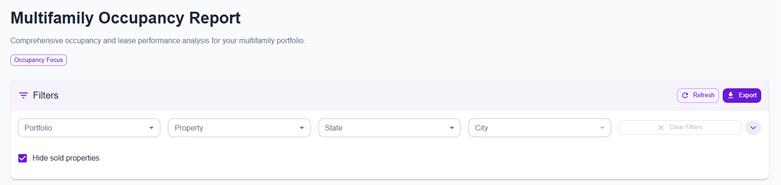
Hide sold properties enhancement
A comprehensive filter for dispositioned properties has been added across financial module views. Drill-down property filtering has been improved to exclude sold or disposed properties from analysis, ensuring more accurate reporting. Property access controls were enhanced to consistently filter out dispositioned assets across reports and analytics workflows.
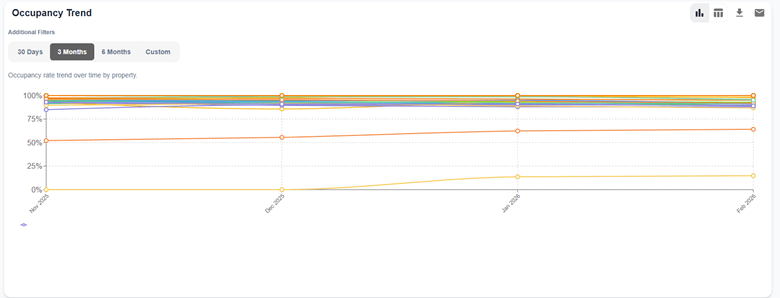
Occupancy trend chart
Introduced a new occupancy rate trend line chart displaying property-level occupancy performance over time. Users can filter by 30 days, 3 months, 6 months, or a custom date range. The chart includes interactive property breakdown dialogs on data point click, a sortable table view, and Excel export functionality. Month-over-month occupancy trends are clearly visualized by property.
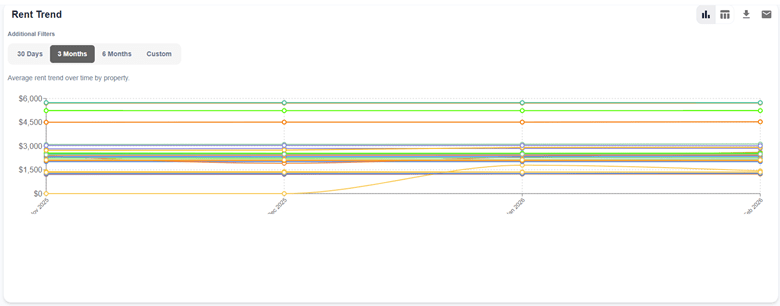
Rent trend chart
Added a new rent trend line chart showing average rent performance by property over time. The chart supports the same period filtering options and includes a custom date selector. Users can click on data points for property-level breakdowns, switch to table view, and export data. Tooltips and axis labels are currency-formatted for improved clarity.
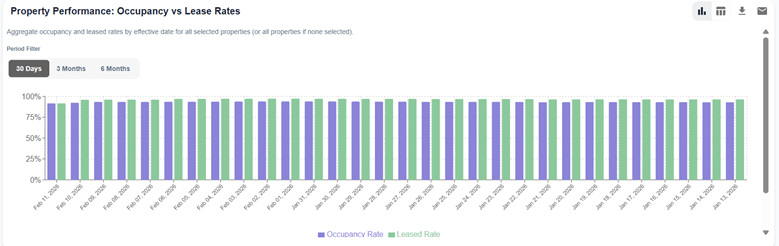
Property performance: occupancy vs lease rates chart
Launched a bar chart comparing occupancy rates and leased rates by effective date. Filters include 30 days, 3 months, and 6 months. Clicking a bar opens a detailed property-level breakdown with total units, occupied units, vacant units, leased units, occupancy and leased percentages, variance between metrics, monthly revenue, and lost rent. Export functionality is included.
Enhancements
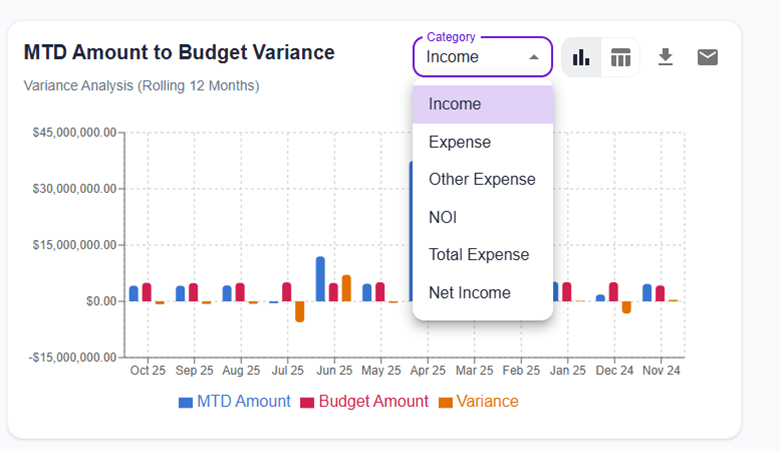
Financial dashboard – MTD vs budget variance improvements
Enhanced the financial dashboard with verified and corrected Month-to-Date versus Budget variance logic. The Year-over-Year total chart calculation logic was also updated for more accurate variance percentage reporting. These improvements provide more reliable financial analysis and improved dashboard consistency.
If you have feedback or feature requests, we’d love to hear from you.