This week’s updates focused on deeper property-level insights, improved drill-down capabilities, enhanced exporting and emailing workflows, and usability refinements across financial and multifamily reports. Below is a summary of the major features and enhancements released between January 23 and January 30, 2026.
New Additions
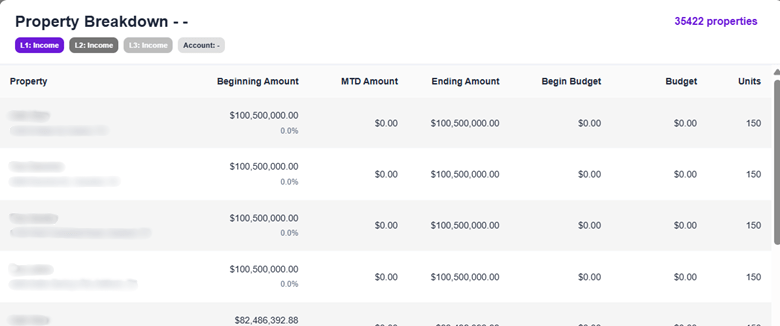
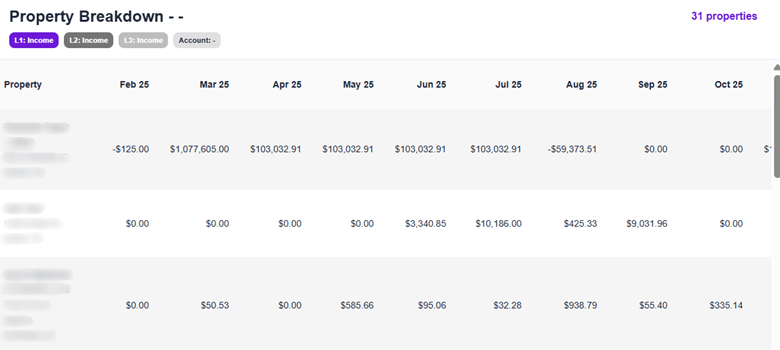
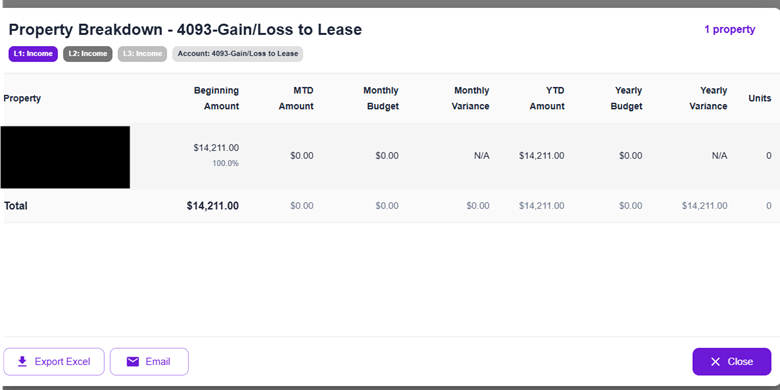
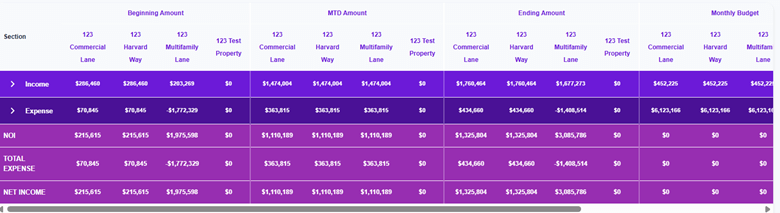
CO-287: Financial reports – property-level breakdown
Property-level breakdown modal drawers have been added across all financial reports, allowing users to drill down into account details by property. Users can now click on any account row to view how balances are distributed across properties, with the ability to export or email the detailed breakdown directly from the modal. This enhancement is available across Financial Summary, Period Comparison, Property Comparison, and T-12 Financial Summary reports.
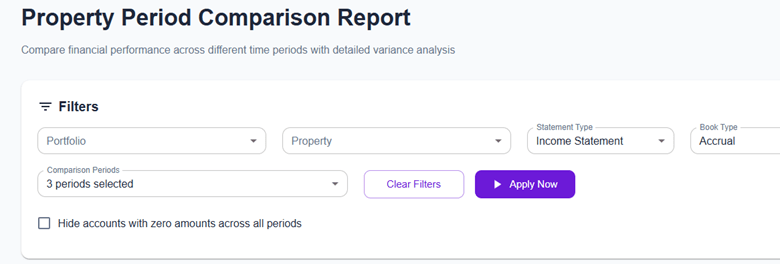
CO-344: Period comparison “Hide Zero Accounts” filter
A new “Hide Zero Accounts” checkbox has been added to the Period Comparison report. This filter removes accounts with zero values across all selected periods, reducing visual clutter and improving readability. The report summary now reflects how many accounts are hidden, and the filter applies consistently across on-screen data, exports, and emailed reports.
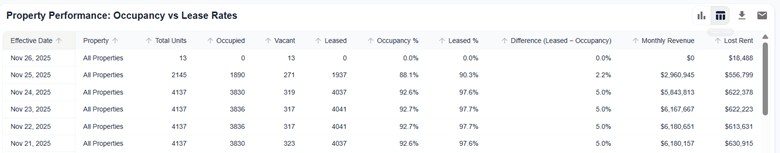
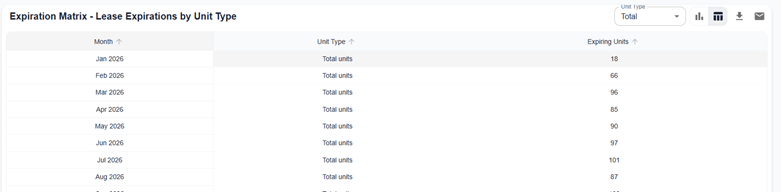
CO-340: Multifamily occupancy chart features
Chart and table view toggle functionality has been added to Property Performance and Expiration Matrix charts in the Multifamily Occupancy report. Users can switch between visual and tabular views, export data to Excel, or email chart visuals or table data directly from the interface. For the Expiration Matrix, a Unit Type filter was added along with improved table aggregation and display.
Enhancements
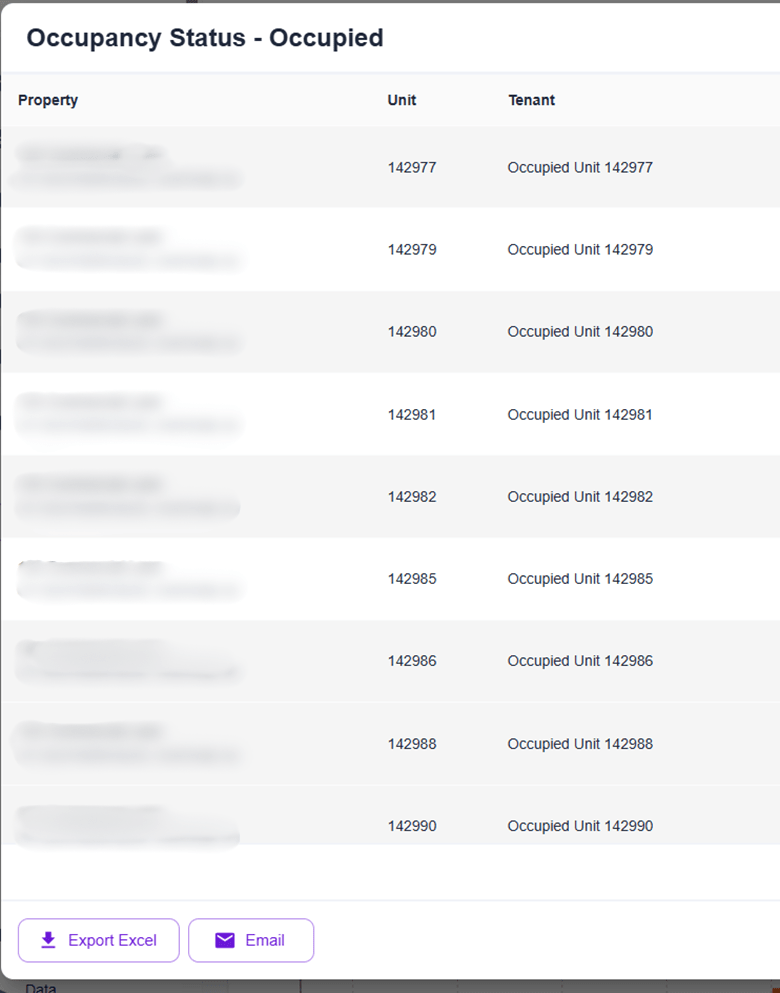
CO-323: Modal drawer exporting and mailing
Export and email functionality has been added to all breakdown dialog boxes across the platform, including financial account breakdowns, property breakdowns, and collections drill-downs. Users can now export data to Excel or email breakdowns directly from modal drawers. A reusable mailing hook was introduced to ensure consistent formatting and behavior across all dialog components.
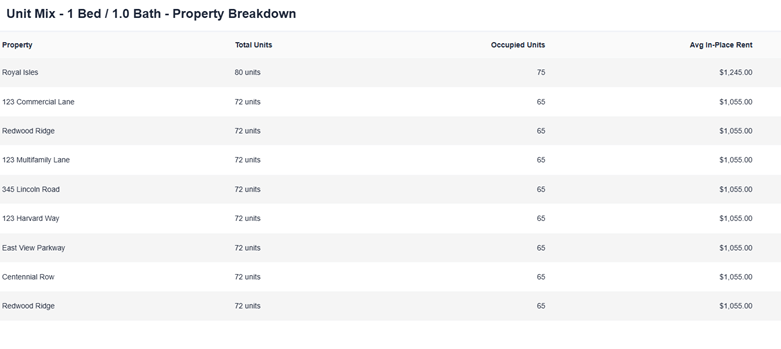
CO-347: Unit mix report clickable feature
The unit mix chart is now interactive. Users can click on any unit type segment to view a detailed property-level breakdown showing how each unit type is distributed across properties. New API endpoints were added to support the drill-down experience.
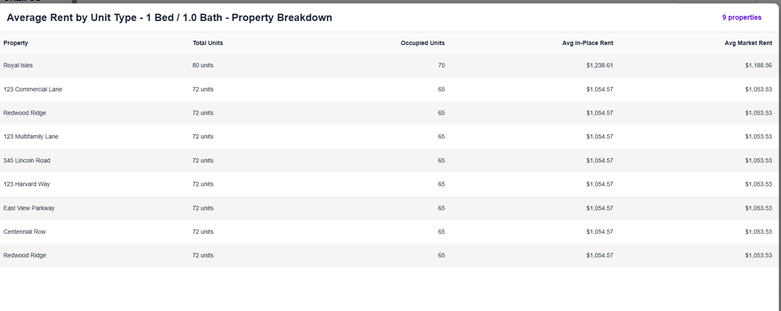
CO-297: Average rent per unit type drill-down
Added clickable functionality to the average rent per unit type chart, allowing users to drill down into property-level average rent details directly from the chart.
CO-252: Export file naming adjustment
Export file naming conventions were improved across all multifamily reports to make exported files easier to identify and organize. Updates apply to Collections, Dashboard, Leasing, Occupancy, Occupancy Budget, Pricing Lab, and Rent Roll reports.
CO-332: Property comparison UI enhancement
Enhanced the Property Comparison report UI by adding border lines between sections, improving visual separation and readability of data.
CO-309: Chart of Accounts management source filter
Added a source filter to the Chart of Accounts management page in Data Governance. Users can now filter accounts by source, making it easier to manage and review accounts from specific data providers and improving overall data governance workflows.
If you have feedback or feature requests, we’d love to hear from you.