Are you a real estate professional excited to begin your Power BI journey? I must say, I’m excited for you! Microsoft’s Power BI grew substantially over the last several years. More and more real estate firms recognize the value of taking action based on trended data. But wait, how do you get started? That’s where we can help. Below are the top 6 real estate Power BI reports.
If you want to see examples, check out our interactive demo on our CRExchange.io website. And great news! These reports are all part of the CREx Software analytics application.
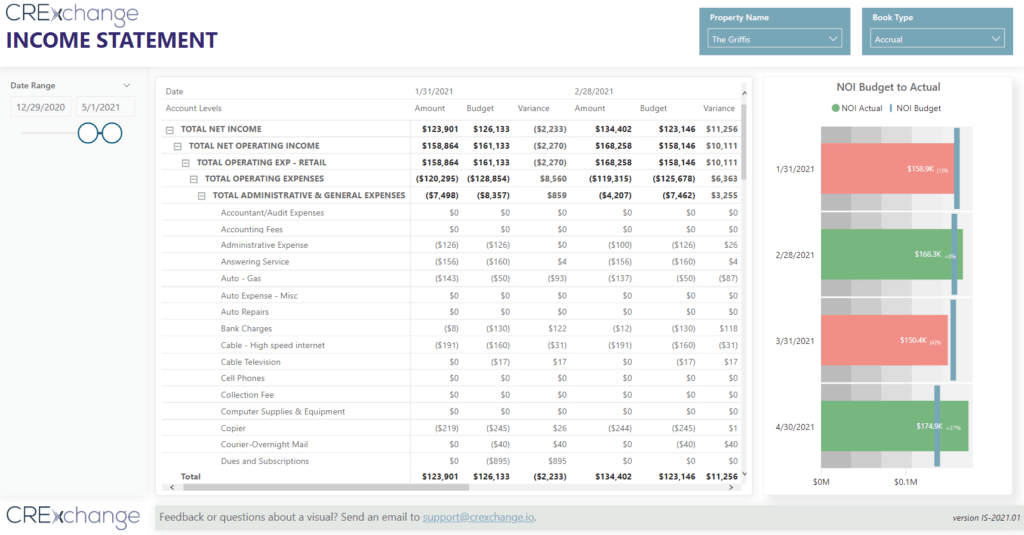
Income Statement Report
First, the income statement is crucial for assessing a property’s investment potential and performance. Net operating income (NOI) affects the owner’s profit when selling. You likely use income statement data to gauge a property’s valuation compared to market rates. Real estate companies monitor the actual income statement against budgets to ensure properties meet or exceed expectations.
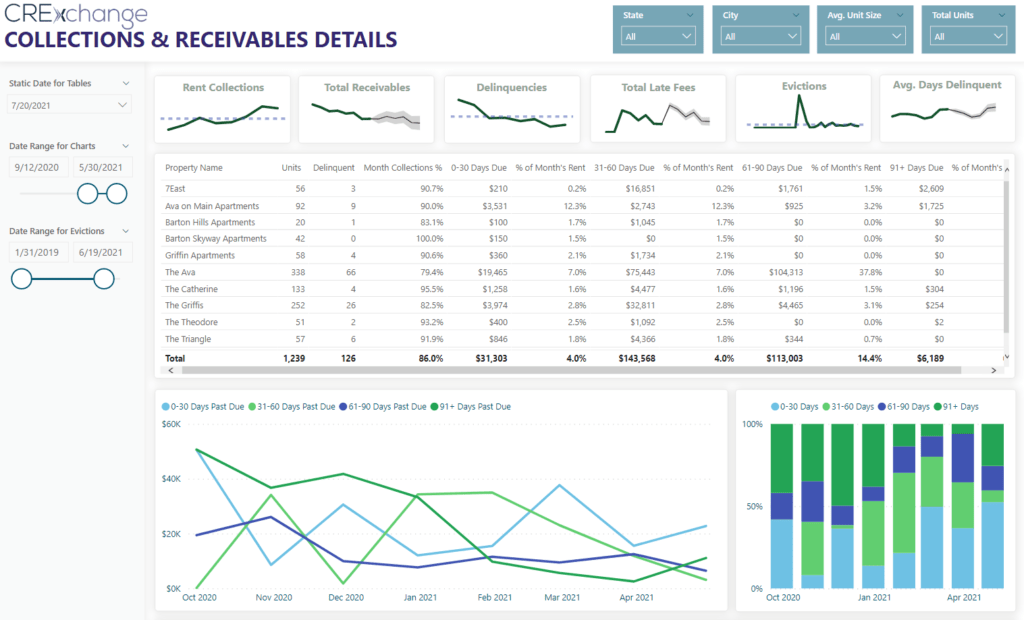
Collections and Receivables Report
Next up: collections and receivables. Collections are vital for property managers and owners to track, with receivables reports indicating how much is owed and by whom. You can even create custom real estate Power BI reports to analyze aged receivables and track trends.
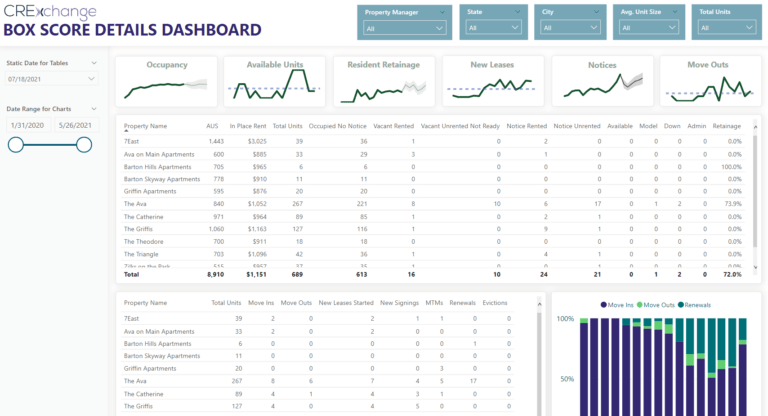
Multifamily Box Score / Commercial Tenancy Report
Monitoring tenants’ KPIs reveals trends in tenant behavior, including lease terminations and renewal rates. Effective property management requires avoiding vacancies and maintaining high renewal rates. You also typically monitor occupancy rates and leased percentages as well as exposure rates across all property types. Commercial owners or managers may also monitor weighted average lease term.
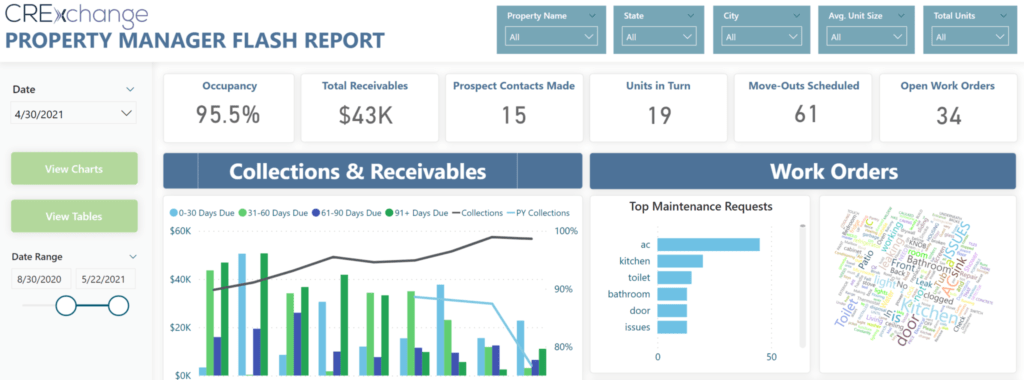
Flash Report
Enter our most popular report: the “Flash Report”. Real estate firms require instant access to their KPIs to monitor each property’s health and ensure tenant satisfaction leading to lease renewals. A “Flash Report” gives you access to all of your core KPIs with links to drill down into details if needed.
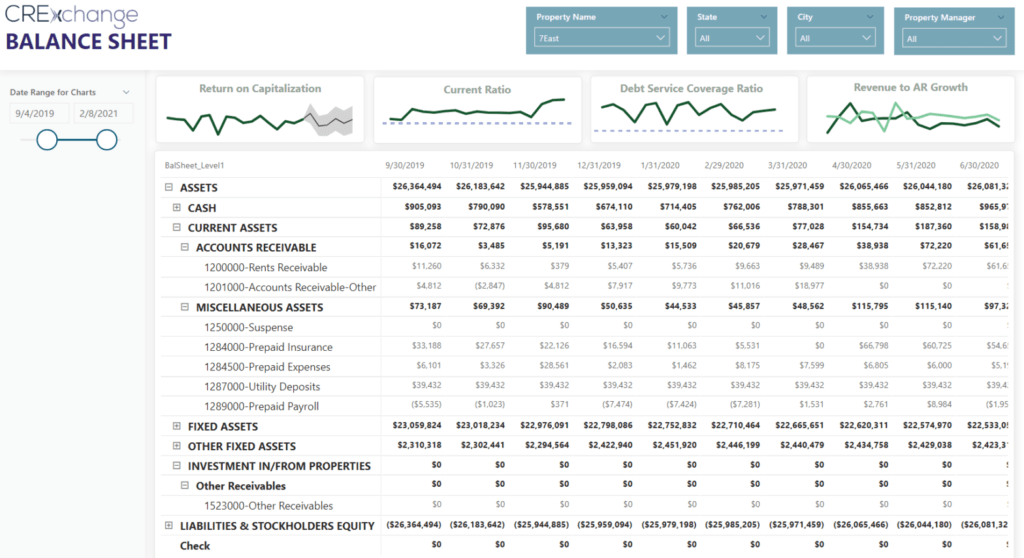
Balance Sheet Report
Real estate firms must utilize the balance sheet daily, as it provides a snapshot of their properties’ financial health at month-end. By analyzing trends over time, changes in KPIs critical to assessing property performance and lender compliance can be anticipated.
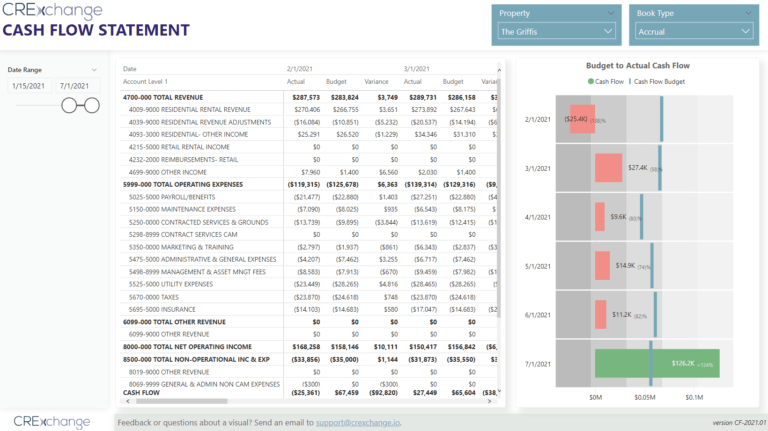
Cash Flow Report
Last but not least, cash flow is a critical financial metric for real estate owners and managers. You calculate cash flow by taking the difference between income and expenses adjusted for non-cash items, like depreciation expense. Higher cash flow results in better long-term returns for owners and investors.
Curious to learn more about the top 6 real estate Power BI reports? Check out our Interactive Demo below or reach out at CRExSoftware.com.
FREE INTERACTIVE DEMO
For more tips, be sure to check out our other blog posts.