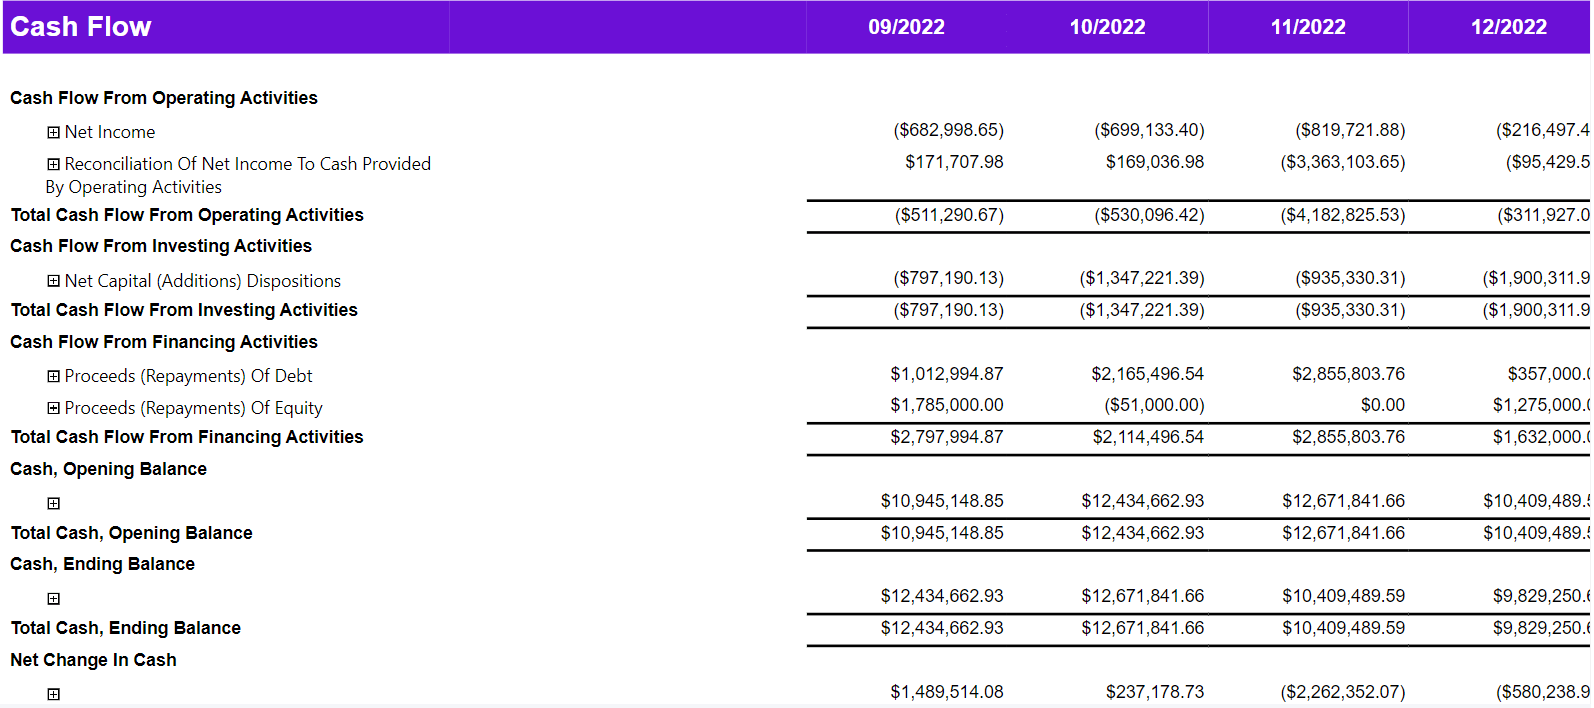
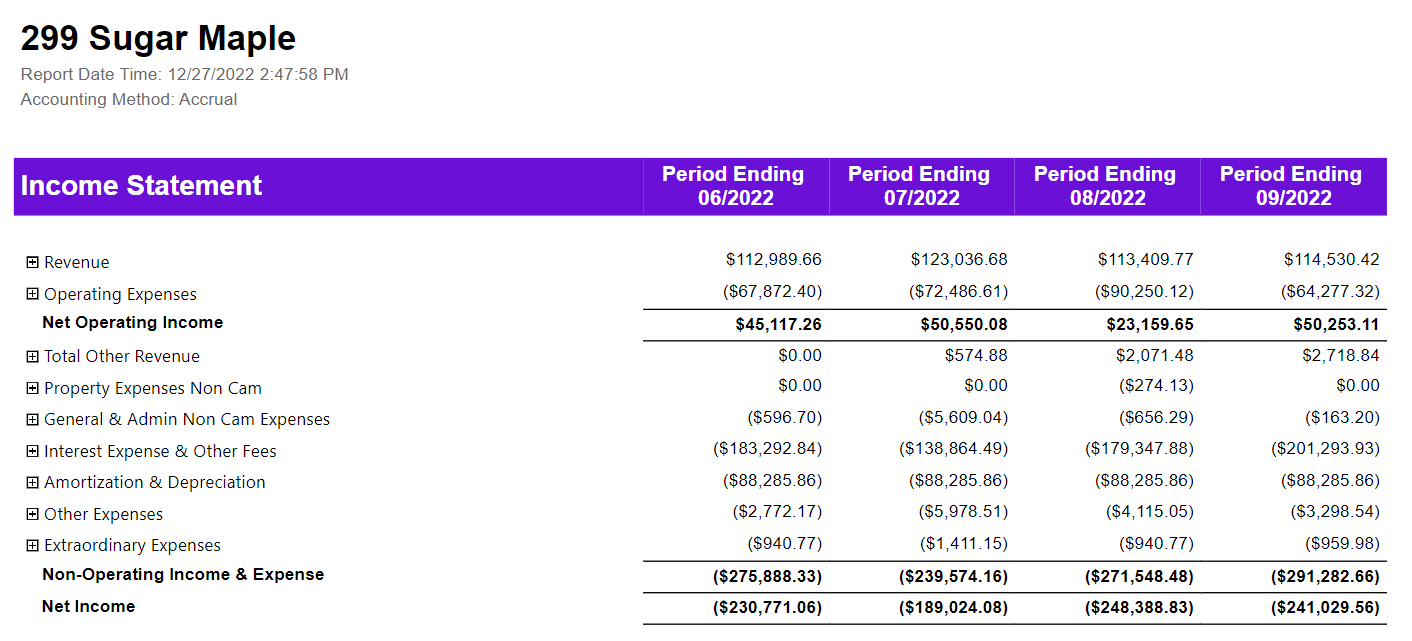
One (un)popular opinion in real estate analytics is that financial reports do not need to be fancy. Despite what you may hear, most accountants and controllers will trade the bells and whistles of gauges and line graphs for accurate and easy-to-read tables. Let’s dive into the benefits of paginated reports for real estate analytics.

Paginated Reports: The New Frontier
Most financial reports need to be in a structured tabular format. This may include the balance sheet, cash flow, income statement, general ledger, or trial balance. The numbers need to add up and be correct, rows and columns need to be grouped, and, most importantly, the report needs to export to Excel. Most modern visualization tools, such as Tableau or Power BI, do a great job at creating charts and matrices. However, they do an awful job of creating easy-to-summarize, group, and exportable reports. Enter paginated reports! In the business intelligence days of old, tools like SSRS and Cognos ruled business analytics. As new powerful tools emerged, SSRS lives on. It has been rebuilt to exist inside of Power BI as paginated reports. At CREx, we built a suite of financial paginated reports to meet the needs of accountants, financial analysts, controllers, and CFOs.
Benefits of Paginated Tabular Reports
- Paginated reports are great at grouping data in formats that match real financial statements, similar to how they would appear in Excel.
- Paginated reports are great at accepting different parameters so you can run, filter, and sort data quickly and easily.
- Paginated reports are highly customizable and are data-driven. You can change the properties of the color, size, shape of text, fields, and cells at runtime to make the reports easier to read.
- Paginated reports run in a tabular format but can also leverage charts and visuals if needed. A good report designer should know how to combine these visualizations into something powerful for your financial team.
- Paginated reports export to Excel in native format. This means all of your grouping will export over to Excel so you can expand and hide cells in Excel the same way you did in the report.

This post scratches the surface of what you can do with paginated reports. With a little training, you can customize these reports to the nth degree and supercharge your financial reporting. To see how CREx does this with our financial suite of reports and saves customers hundreds of hours a month, reach out to us. We’re always happy to help!
For more tips, be sure to check out our other blog posts.
The Benefits of Paginated Reports for Real Estate Analytics.