This week’s updates introduce new pricing analytics, enhanced financial visualizations, and expanded rent roll and balance sheet insights. These improvements are designed to give teams clearer visibility into pricing performance, budget variance, and property-level financial data across their portfolios.
New Additions
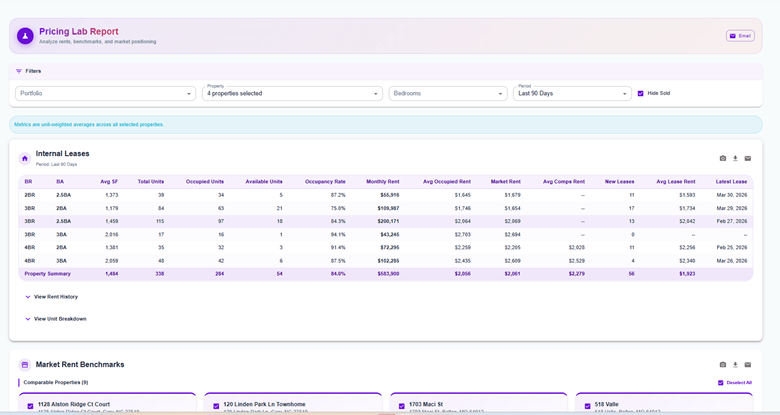
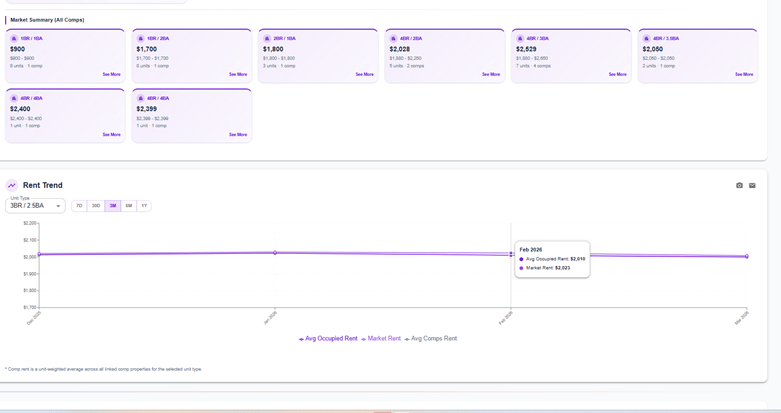
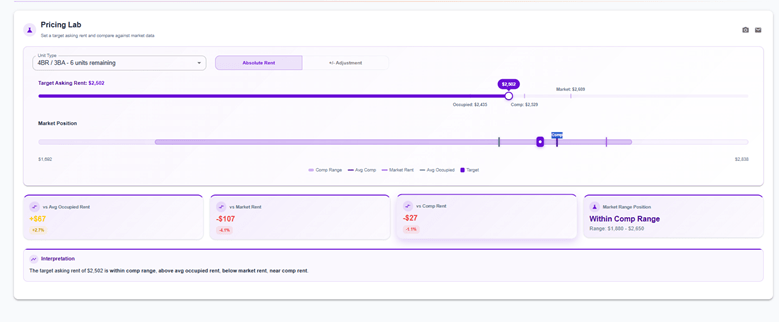
Pricing Lab Reports
The new Pricing Lab Reports provide a comprehensive analysis tool for evaluating internal leases alongside market benchmarks. Users can drill down into comp-level data through detailed dialogs, with unit breakdowns now displaying property names for clearer context. Reports also include export functionality, allowing users to download charts as images or PDFs for easy sharing and offline review.
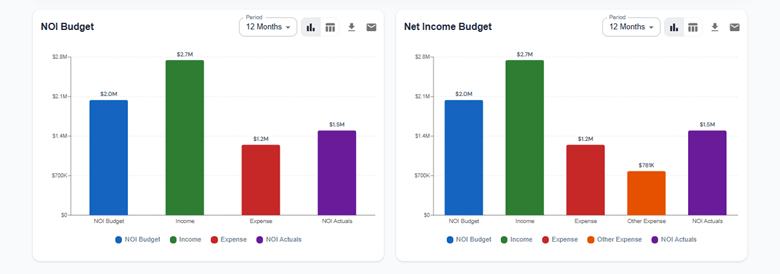
Budget Waterfall Charts
New waterfall chart visualizations have been added to Budget Comparison views in the Financial Dashboard. These charts break down how individual line items contribute to overall budget variance, making it easier to identify areas of over- or under-performance. Updated backend analytics ensure the data remains accurate and up to date.
Rent Roll & Summary Cards
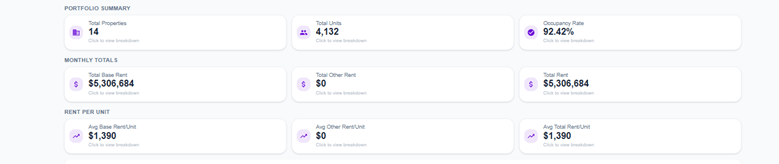
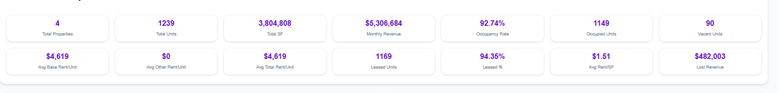
A new Rent Roll Comparison Report enables side-by-side analysis of rent roll data across different periods, along with a Rent Roll Issues Card that highlights discrepancies and items requiring attention. Additionally, new Other Rent and Total Monthly Rent Summary Cards have been added to the Multifamily Dashboard, giving teams a quick snapshot of key revenue metrics.
Property Breakdown for Balance Statement
The Balance Sheet has been enhanced with property-level drill-down capabilities. Users can now view detailed financial data by property through Financial Account Breakdown dialogs and comparison views. Updated calculations ensure accurate unit counts and per-property figures across Financial Summary, Period Comparison, and Investor Reports.
If you have feedback or feature requests, we’d love to hear from you.