This week’s updates focus on smarter insights, improved data transparency, and enhanced rent roll analysis. With the introduction of AI-driven insights, expanded tooltip support, and new rent roll diagnostics, teams can better understand their data and quickly identify issues across their portfolio.
New Additions
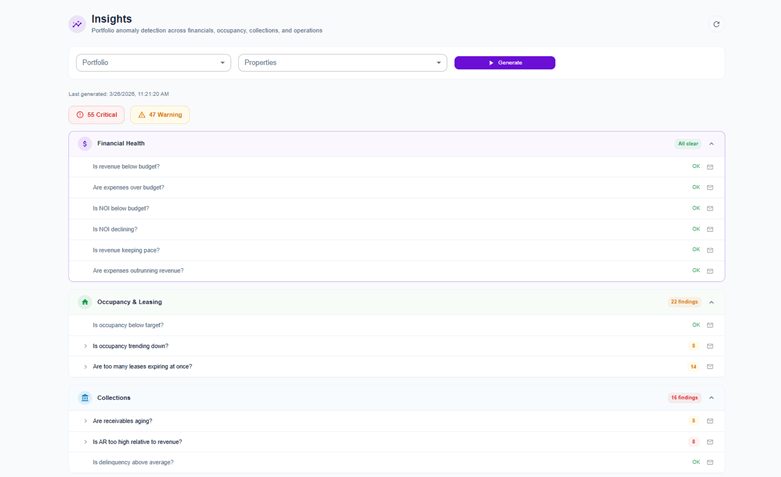
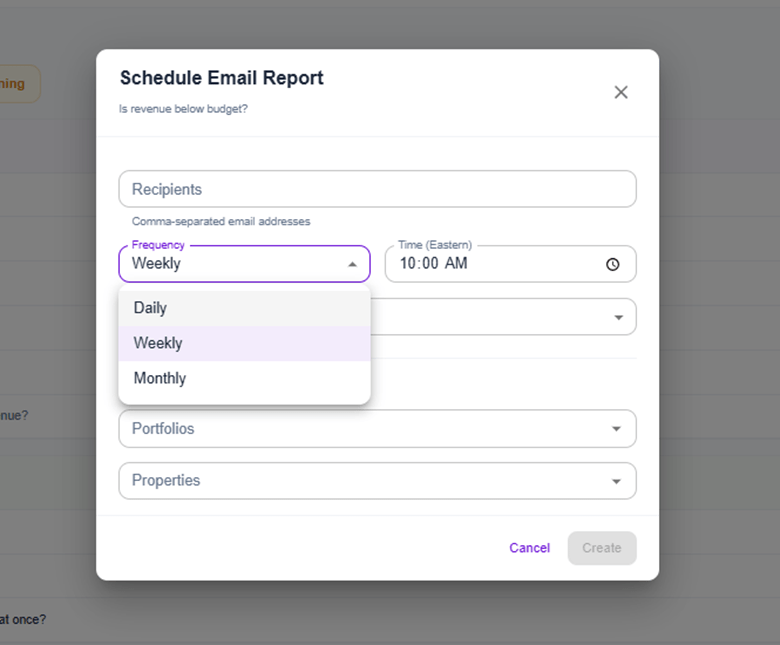
Updated Insights Page with Smart Insights Panel
The Insights page has been redesigned with a new Smart Insights Panel powered by an AI-driven insight engine. The platform now automatically generates data-driven insights and supports scheduled insights with email notifications. New interactive charts—including Loss to Lease, Portfolio Snapshot, Rent Growth, and Rent to Market—provide deeper visibility into performance trends. A last-updated indicator and improved GPR logic ensure data accuracy and transparency.
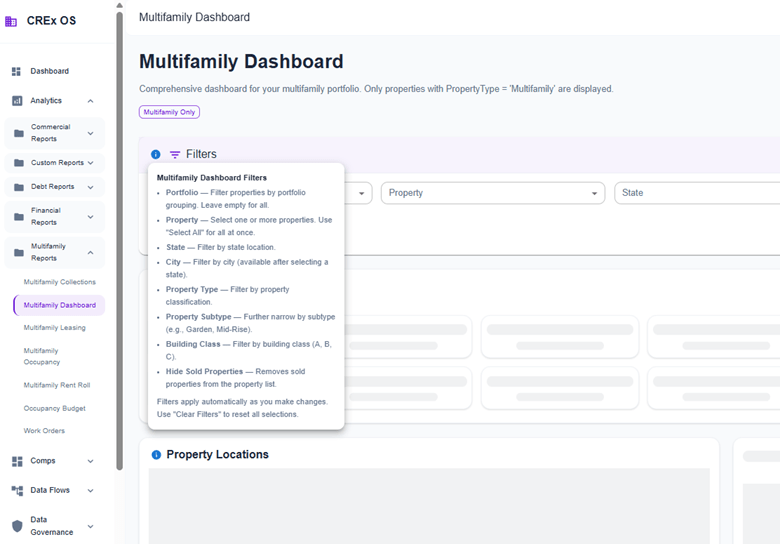
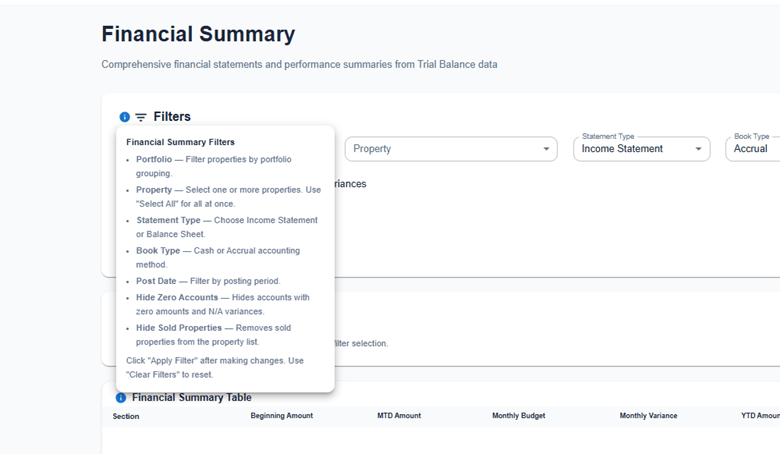
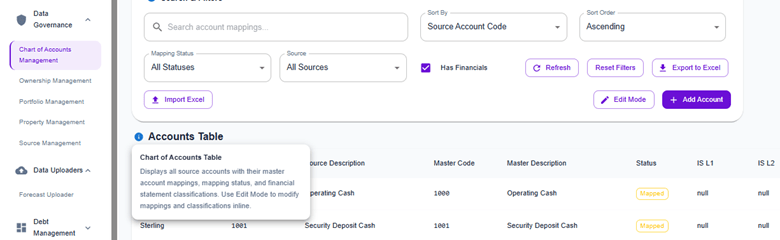
Contextual Tooltips Across Platform
Added 77 contextual tooltips across more than 20 pages, covering Data Governance, Comparables, Financial, and Multifamily modules. These tooltips provide inline explanations for fields and metrics, helping users better understand data without leaving the page. Icons have been repositioned for a more consistent and scannable layout.
Enhancements
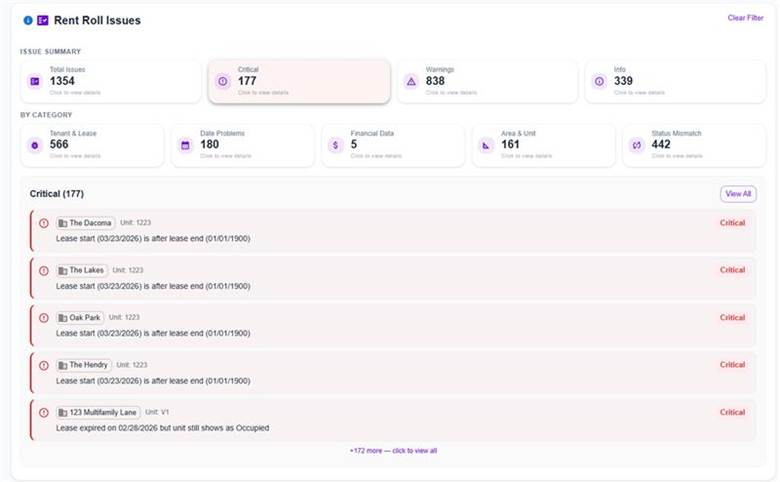
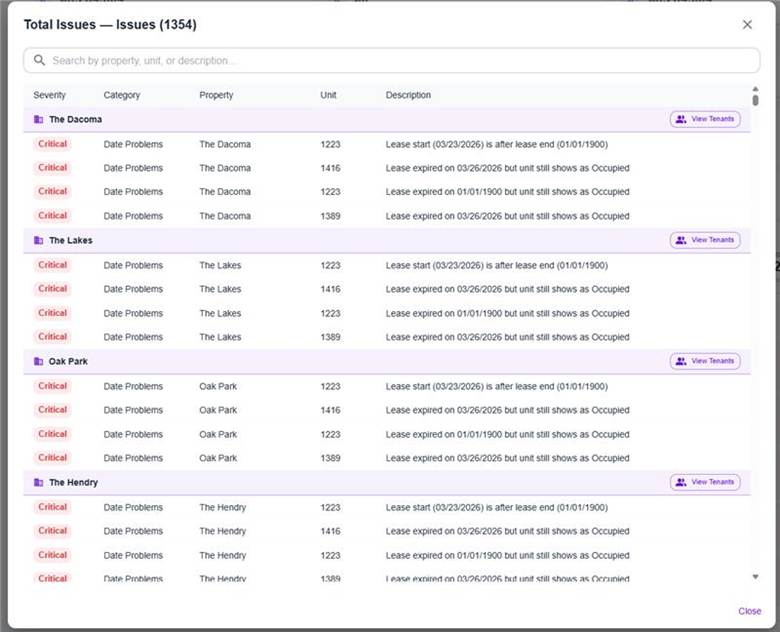
Rent Roll Issues Card
A new Rent Roll Issues card has been added to the Multifamily Rent Roll report. This feature automatically scans rent roll data and flags issues across categories such as Tenant & Lease, Date Problems, Financial Data, Area & Unit, and Status Mismatch. Issues are classified by severity (Critical, Warning, Info), and users can view them inline or in a detailed dialog grouped by property, with search functionality for faster investigation.
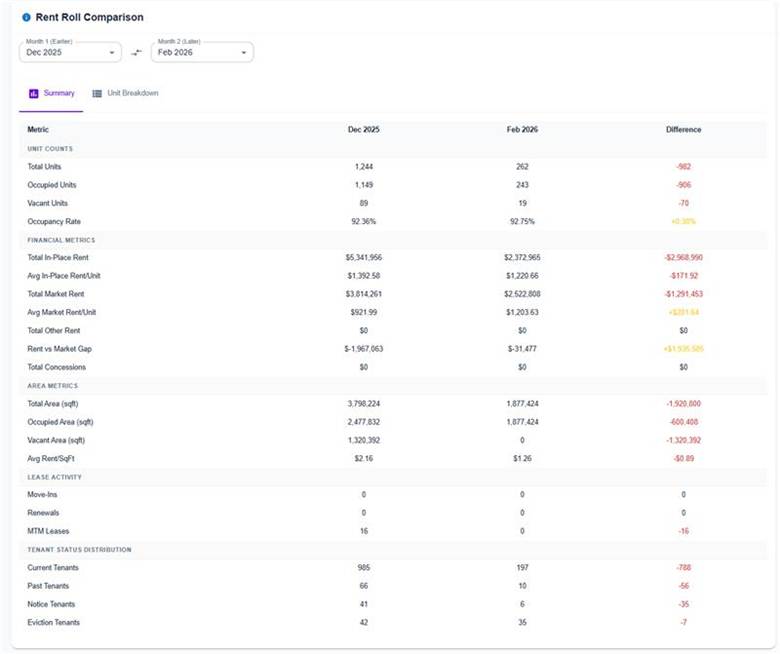
Rent Roll Comparison Card
A new Rent Roll Comparison card enables side-by-side analysis of rent roll data across two time periods. The Summary view highlights key differences in metrics such as occupancy, rent, and lease activity, while the Unit Breakdown view provides detailed unit-level comparisons grouped by property. This helps teams quickly identify rent changes, turnover, and occupancy trends.
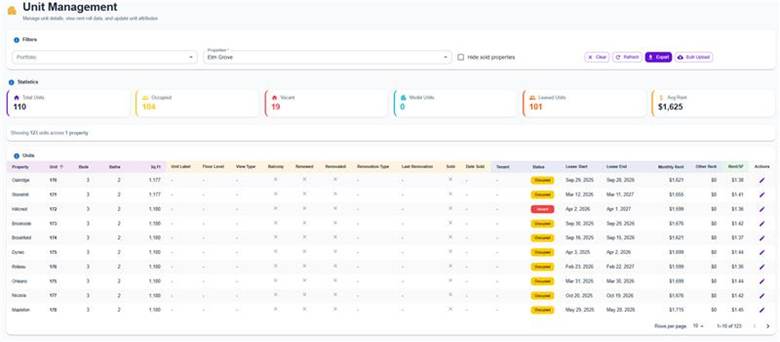
Unit Management: Sold & Date Sold Columns
Two new columns—Sold and Date Sold—have been added to the Unit Management table. These fields allow users to track unit sale status directly within the data governance interface, improving visibility into asset lifecycle and unit-level changes.
If you have feedback or feature requests, we’d love to hear from you.